mirror of
https://github.com/lephisto/pfsense-analytics.git
synced 2025-12-06 04:19:19 +01:00
208 lines
9.4 KiB
Markdown
208 lines
9.4 KiB
Markdown
This Project aims to give you better insight of what's going on your pfSense Firewall. It's based on some heavylifting done by devopstales and opc40772. I wrapped some docker-compose glue around it, to make it a little bit easier to get up and running. It should work hasslefree with a current Linux that has docker and docker-compose. There are still a number of manual steps required.
|
|
|
|
The whole Metric approach is split into several subtopics.
|
|
|
|
| Metric type | Stored via | stored in | Visualisation |
|
|
| ------------- |:---------------------: | --------------: | --------------: |
|
|
| pfSense IP Filter Log | Graylog | Elasticsearch | Grafana |
|
|
| NTOP DPI Data | NTOP timeseries export | InfluxDB | Grafana |
|
|
|
|
Optional Succicata/SNORT logs can be pushed to Elasticsearch, Graylog has ready made extractors for this, but currently this is not included in this Documentation.
|
|
|
|
This walkthrough has been made with a fresh install of Ubuntu 18.04 Bionic but should work flawless with any debian'ish linux distro.
|
|
|
|
# System requirements
|
|
|
|
Install docker, docker-compose and git.
|
|
|
|
```
|
|
ubuntu@pfanalytics:~$ sudo apt install docker.io docker-compose git
|
|
...
|
|
|
|
```
|
|
|
|
# Prepare Docker
|
|
|
|
Let's pull this repo to the Server where you intend to run the Analytics front- and backend.
|
|
|
|
```
|
|
git clone https://github.com/lephisto/pfsense-graylog
|
|
cd pfsense-graylog
|
|
```
|
|
|
|
We have to adjust some Systemlimits to allow Elasticsearch to run:
|
|
|
|
```
|
|
sudo sysctl -w vm.max_map_count=262144
|
|
```
|
|
|
|
to make it permanent edit /etc/sysctl.conf and add the line:
|
|
|
|
```
|
|
vm.max_map_count=262144
|
|
```
|
|
|
|
Next we edit the docker-compose.yml file and set some values:
|
|
|
|
The URL you want your Graylog to be available under:
|
|
- GRAYLOG_HTTP_EXTERNAL_URI (eg: http://localhost:9000)
|
|
|
|
A Salt for encrypting your Gralog passwords
|
|
- GRAYLOG_PASSWORD_SECRET (Change that _now_)
|
|
|
|
Now spin up the stack with:
|
|
|
|
```
|
|
docker-compose up
|
|
```
|
|
|
|
This should expose you the following services externally:
|
|
|
|
| Service | URL | Default Login | Purpose |
|
|
| ------------- |:---------------------:| --------------:| --------------:|
|
|
| Graylog | http://localhost:9000 | admin/admin | Configure Data Ingestions and Extractors for Log Inforation |
|
|
| Grafana | http://localhost:3000 | admin/admin | Draw nice Graphs
|
|
| Cerebro | http://localhost:9001 | none - provide with ES API: http://elasticsearch:9200 | ES Admin tool. Only required for setting up the Index.
|
|
|
|
Depending on your Hardware after a few minutes you should be able to connect to
|
|
your Graylog Instance on http://localhost:9000. Let's see if we can login with username "admin", password "admin".
|
|
|
|
# Indices
|
|
|
|
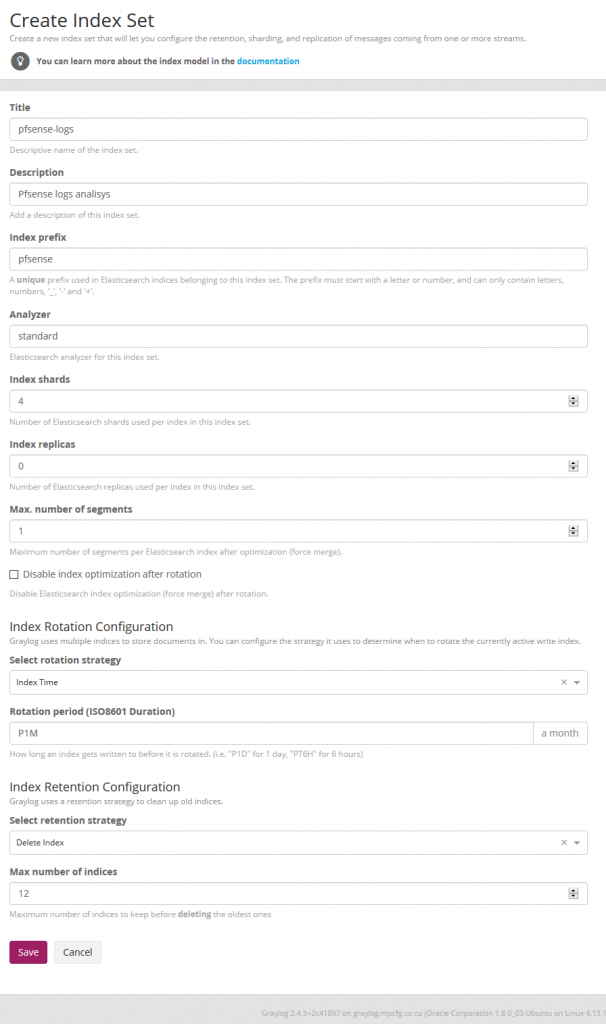
We now have to create the Indices in Elasticsearch for the Pfsense logs in System / Indexes
|
|
|
|
|
|
|
|
Index shard 4 and Index replicas 0, the rotation of the Index time index and the retention can be deleted, closure of an index according to the maximum number of indices or doing nothing. In my case, I set it to rotate monthly and eliminate the indexes after 12 months. In short there are many ways to establish the rotation. This index is created immediately.
|
|
|
|

|
|
|
|
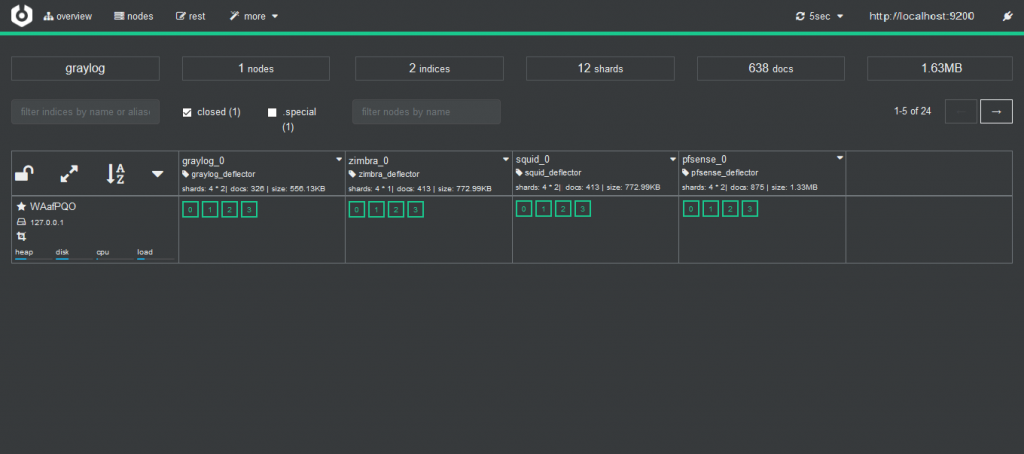
and with [cerebro](https://github.com/lmenezes/cerebro) we can check it. You can access Cerebro under http://localhost:9001 and enter "http://elasticsearch:9200" as URL.
|
|
|
|
|
|
|
|
# Content Pack
|
|
|
|
This content pack includes Input rsyslog type , extractors, lookup tables, Data adapters for lockup tables and Cache for lookup tables.
|
|
|
|
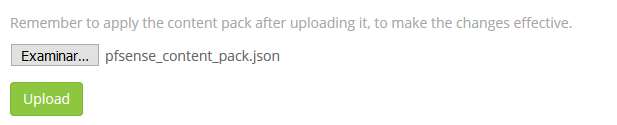
We can take it from the Git directory or sideload it from github to the Workstation you do the deployment on:
|
|
|
|
https://github.com/lephisto/pfsense-graylog/raw/master/pfsense_content_pack/graylog3/3-pfsense-analysis.json
|
|
|
|
|
|
|
|
|
|
As we see, it is add to the list
|
|
|
|
|
|
|
|
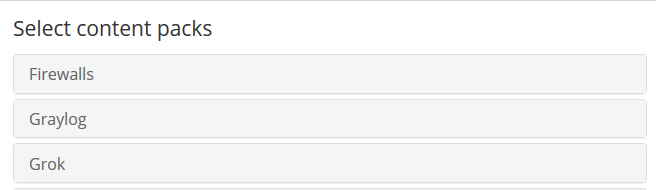
Now we select the Pfsense content pack
|
|
|
|
|
|
|
|
And we apply it
|
|
|
|

|
|
|
|
# Streams
|
|
|
|
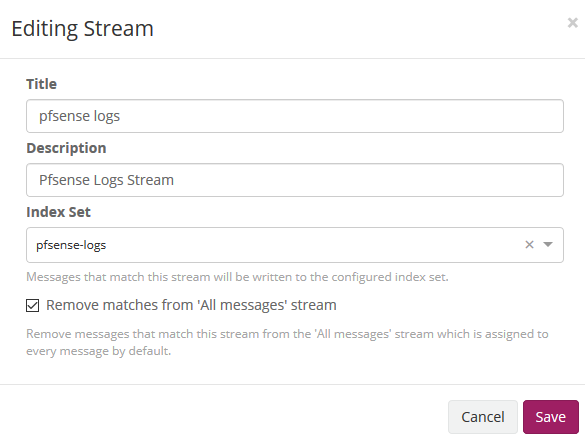
We edit the stream of pfsense in Streams to associate the index that we created initially. We mark that it eliminates the coincidences for the default stream 'All message' so that only it stores it in the index of pfsense.
|
|
|
|
|
|
|
|
# Cerebro
|
|
|
|
This part might be a little bit confusing, so read carefully!
|
|
|
|
As previously explained, by default graylog for each index that is created generates its own template and applies it every time the index rotates. If we want our own templates we must create them in the same elasticsearch. We will add the field real_timestamp that will be useful when using grafana and we also convert the geo type dest_ip_geolocation and src_ip_geolocation to type geo_point to be used in the World Map panels since graylog does not use this format.
|
|
|
|
Get the Index Template from the GIT repo you cloned or sideload it from:
|
|
|
|
https://raw.githubusercontent.com/lephisto/pfsense-graylog/master/Elasticsearch_pfsense_custom_template/pfsense_custom_template_es6.json
|
|
|
|
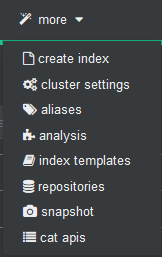
To import personalized template open cerebro and will go to more/index template
|
|
|
|
|
|
|
|
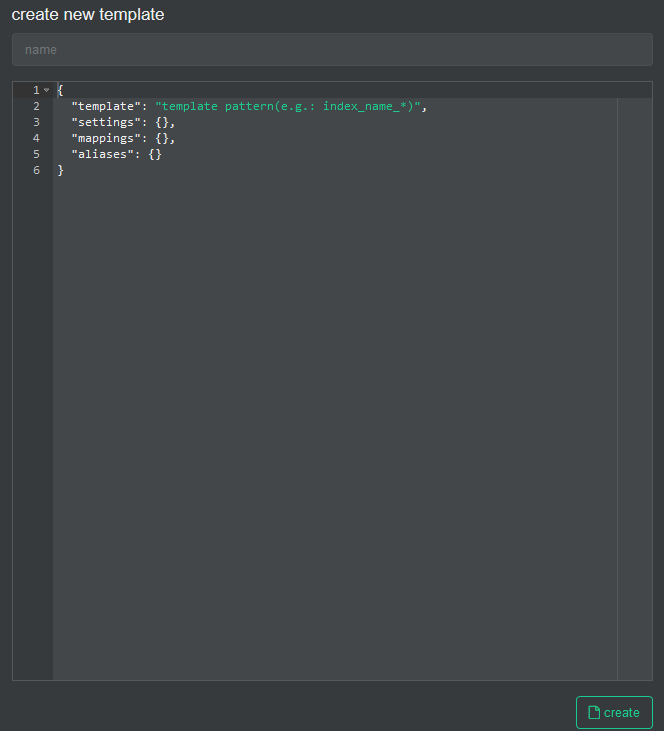
We create a new template
|
|
|
|
|
|
|
|
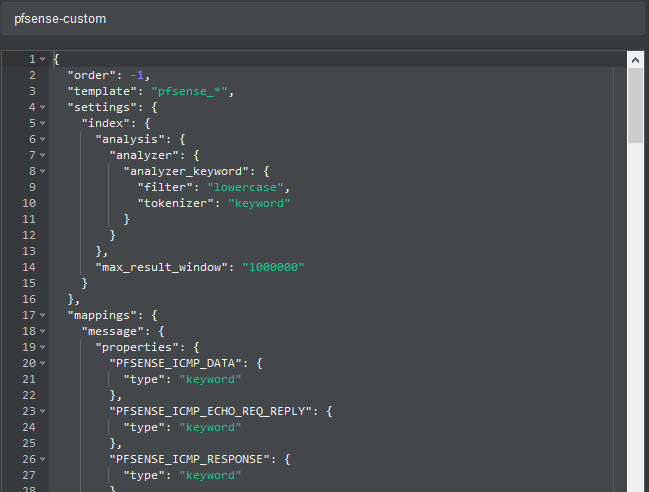
In the name we fill it with pfsense-custom and open the git file that has the template and paste its content here.
|
|
|
|
|
|
|
|
And then we press the create button.
|
|
|
|
_!!! IMPORTANT: Now we will stop the graylog service to proceed to eliminate the index through Cerebro._
|
|
|
|
`sudo docker-compose stop graylog`
|
|
|
|
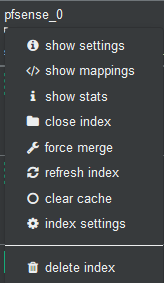
In Cerebro we stand on top of the index and unfold the options and select delete index.
|
|
|
|
|
|
|
|
We start the graylog service again and this will recreate the index with this template.
|
|
|
|
`sudo docker-compose start graylog`
|
|
|
|
Pipelines
|
|
|
|
The pfsense logs that arrive at graylog, the date and the time are not sent to it, storing in the timestamp field the time they arrive at the graylog itself and this date and time is in UTC format so we must modify it so that it does not there are interpretation problems in grafana time format when displaying them.
|
|
|
|
We need to edit the pipeline of pfsense then in System/Pipelines
|
|
|
|
Source of the rule that makes the adjustment of the timestamp that we are going to use in grafana:
|
|
|
|
rule "timestamp_pfsense_for_grafana"
|
|
when
|
|
has_field("timestamp")
|
|
then
|
|
// the following date format assumes there's no time zone in the string
|
|
let source_timestamp = parse_date(substring(to_string(now("America/Habana")),0,23), "yyyy-MM-dd'T'HH:mm:ss.SSS");
|
|
let dest_timestamp = format_date(source_timestamp,"yyyy-MM-dd HH:mm:ss");
|
|
set_field("real_timestamp", dest_timestamp);
|
|
end
|
|
|
|
We save and we have the pipeline ready to later receive the first logs.
|
|
|
|
# Pfsense
|
|
|
|
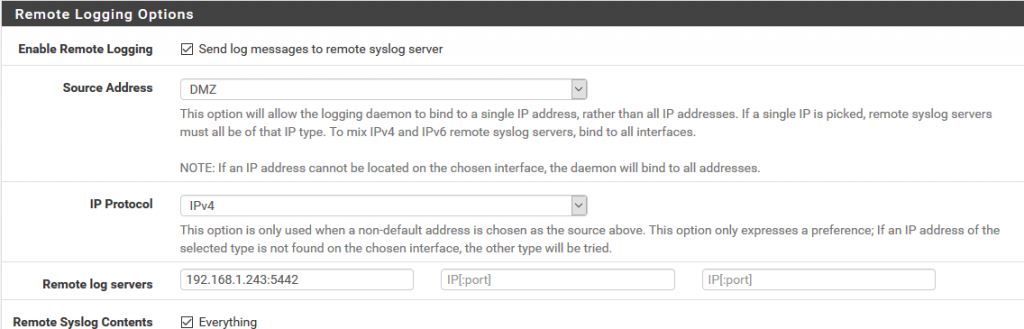
We will now prepare Pfsense to send the log logs to the graylog and for this in Status/System Logs/ Settings we will modify the options that will allow us to do so.
|
|
|
|
We go to the Remote Logging Options section and in Remote log servers we specify the ip address and the port prefixed in the content pack in the pfsense input of graylog that in this case 5442.
|
|
|
|
|
|
|
|
We save the configuration.
|
|
|
|
# Graylog
|
|
|
|
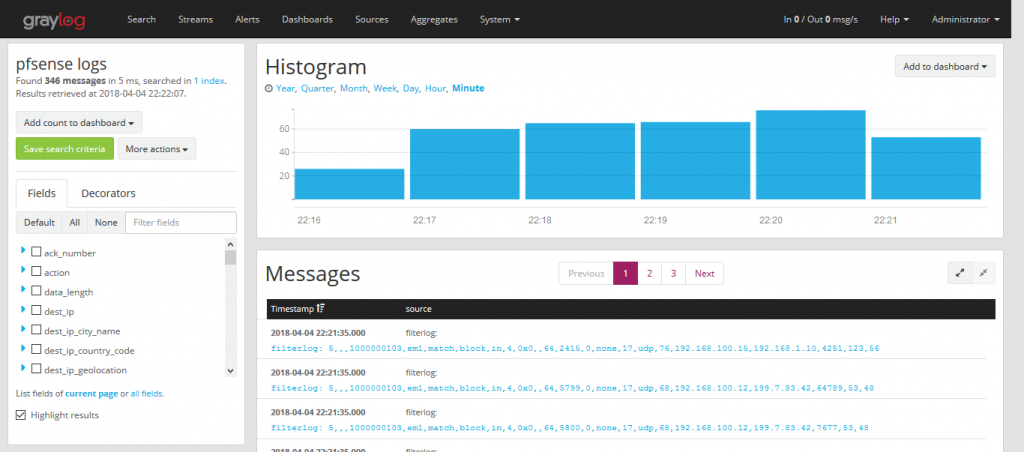
We now go to graylog by selecting the pfsense stream and we will see how it is parsing the log messages creating the fields.
|
|
|
|
|
|
|
|
# Grafana
|
|
|
|
Graylog dashboards do not offer the possibilities to my way of seeing that grafana has so our dashboard will do in grafana.
|
|
|
|
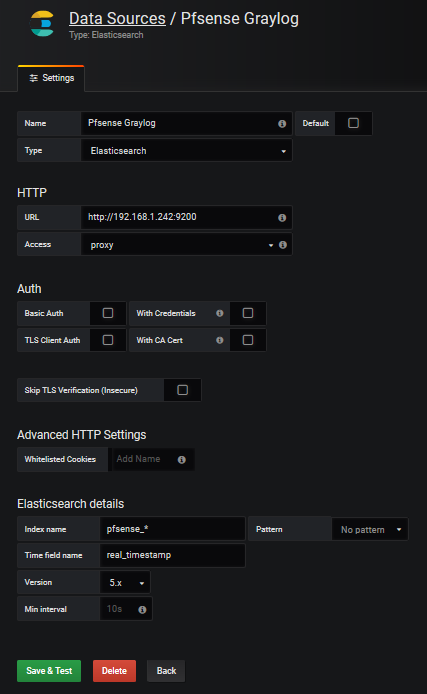
We create the datasource in grafana which we will name Pfsense-Graylog
|
|
|
|
|
|
|
|
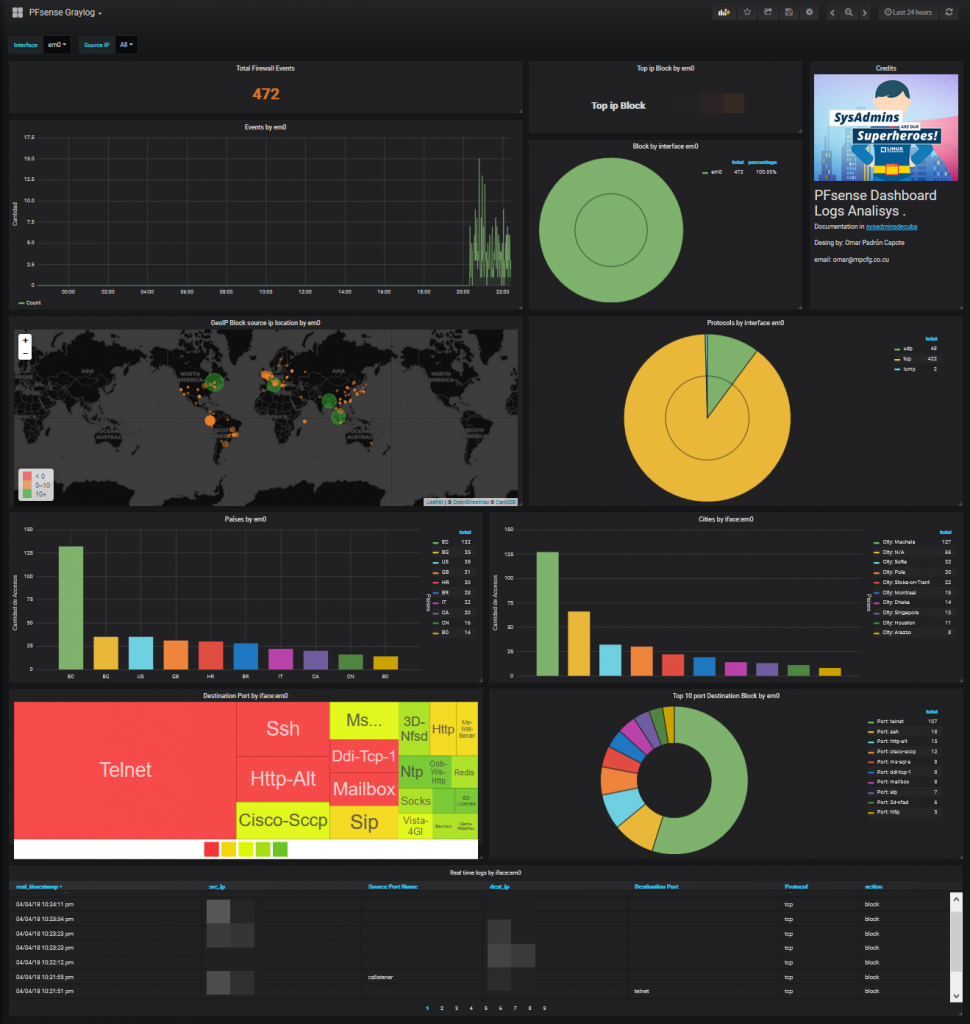
I share with you a [predesigned dashboard](https://grafana.com/dashboards/5420) in the official grafana site which could be imported.
|
|
|
|
|
|
|
|
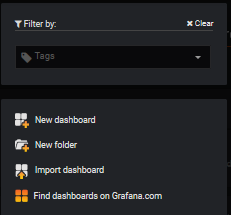
We select Import dashboard
|
|
|
|
|
|
|
|
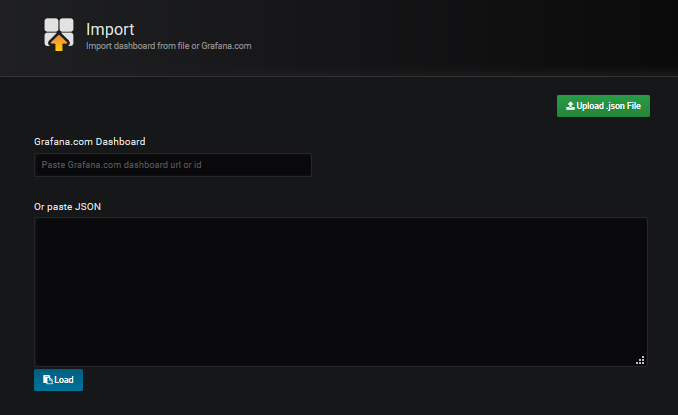
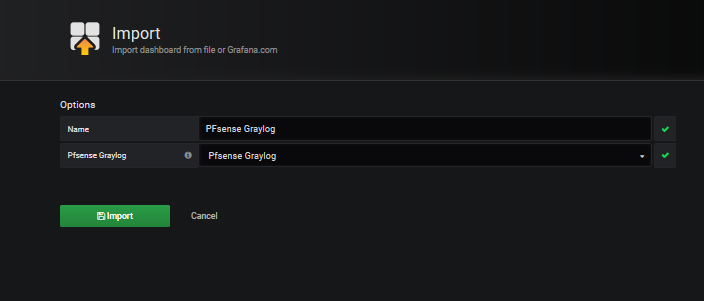
We upload the downloaded file Upload .json file and associate it with the datasource created for it.
|
|
|
|
|
|
|
|
We can already see the dashboard in action.
|
|
|
|
|